#1. Patient Visit Metrics
#2. Schedule Utilization Metrics
#3. Population Health Metrics
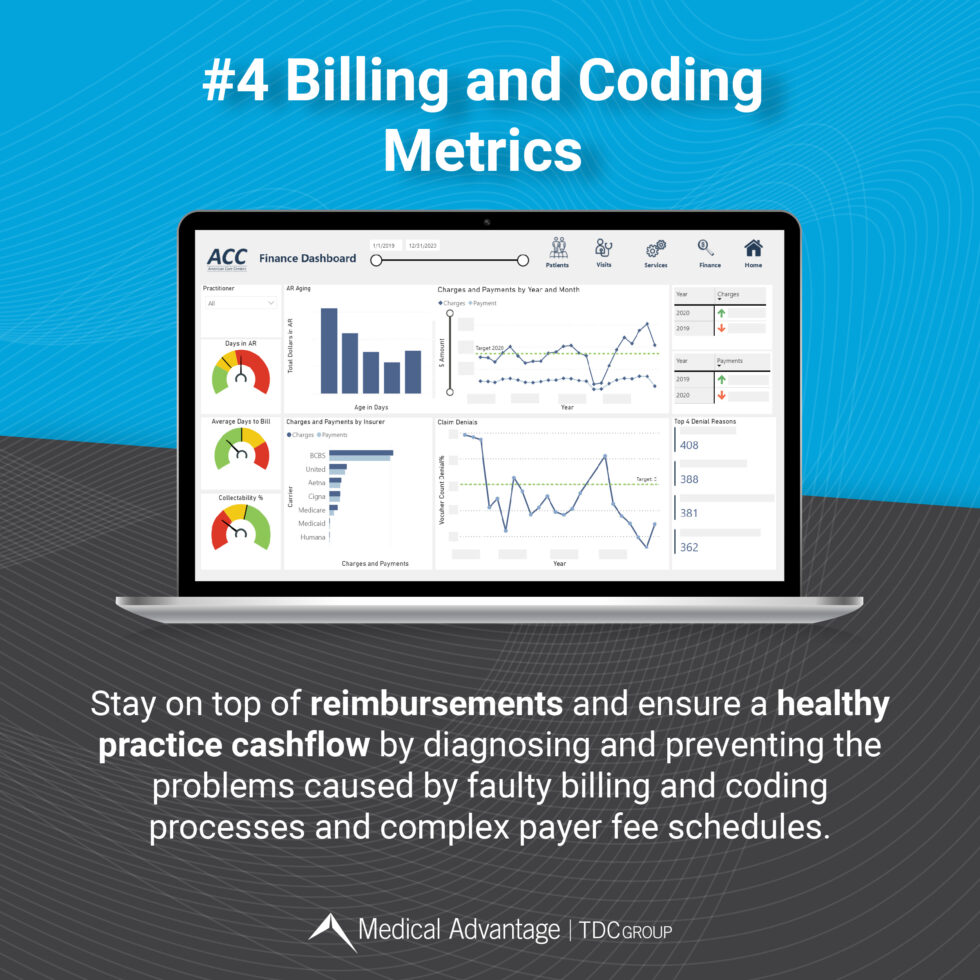
#4. Billing and Coding Metrics
Healthcare Analytics Dashboards: All Your Healthcare KPIs in One Place
Talk to a Healthcare Dashboards Expert Today
As the healthcare landscape continues to shift toward value-based care – and antiquated, fee-for-service models continue to be supplanted by fee-for-value ones – healthcare metrics to improve performance are becoming more and more in-demand.
Also known as healthcare KPIs (Key Performance Indicators) or healthcare dashboard metrics, healthcare metrics are statistics or data which help healthcare professionals see how their organization is performing in financial, clinical, operational, and other areas. In other words, healthcare metrics are like “vitals” which allow you to assess the health of your medical business.
Healthcare metrics to improve performance can be as varied as the medical practices which use them (for example: primary care providers, specialists, FQHCs, ACOs, and other organizations may all have very different healthcare KPIs they want to track.)
That being said, certain healthcare metrics are important to performance for nearly all healthcare organizations. Here are four of the most important healthcare metrics to track to improve performance for your healthcare organization.
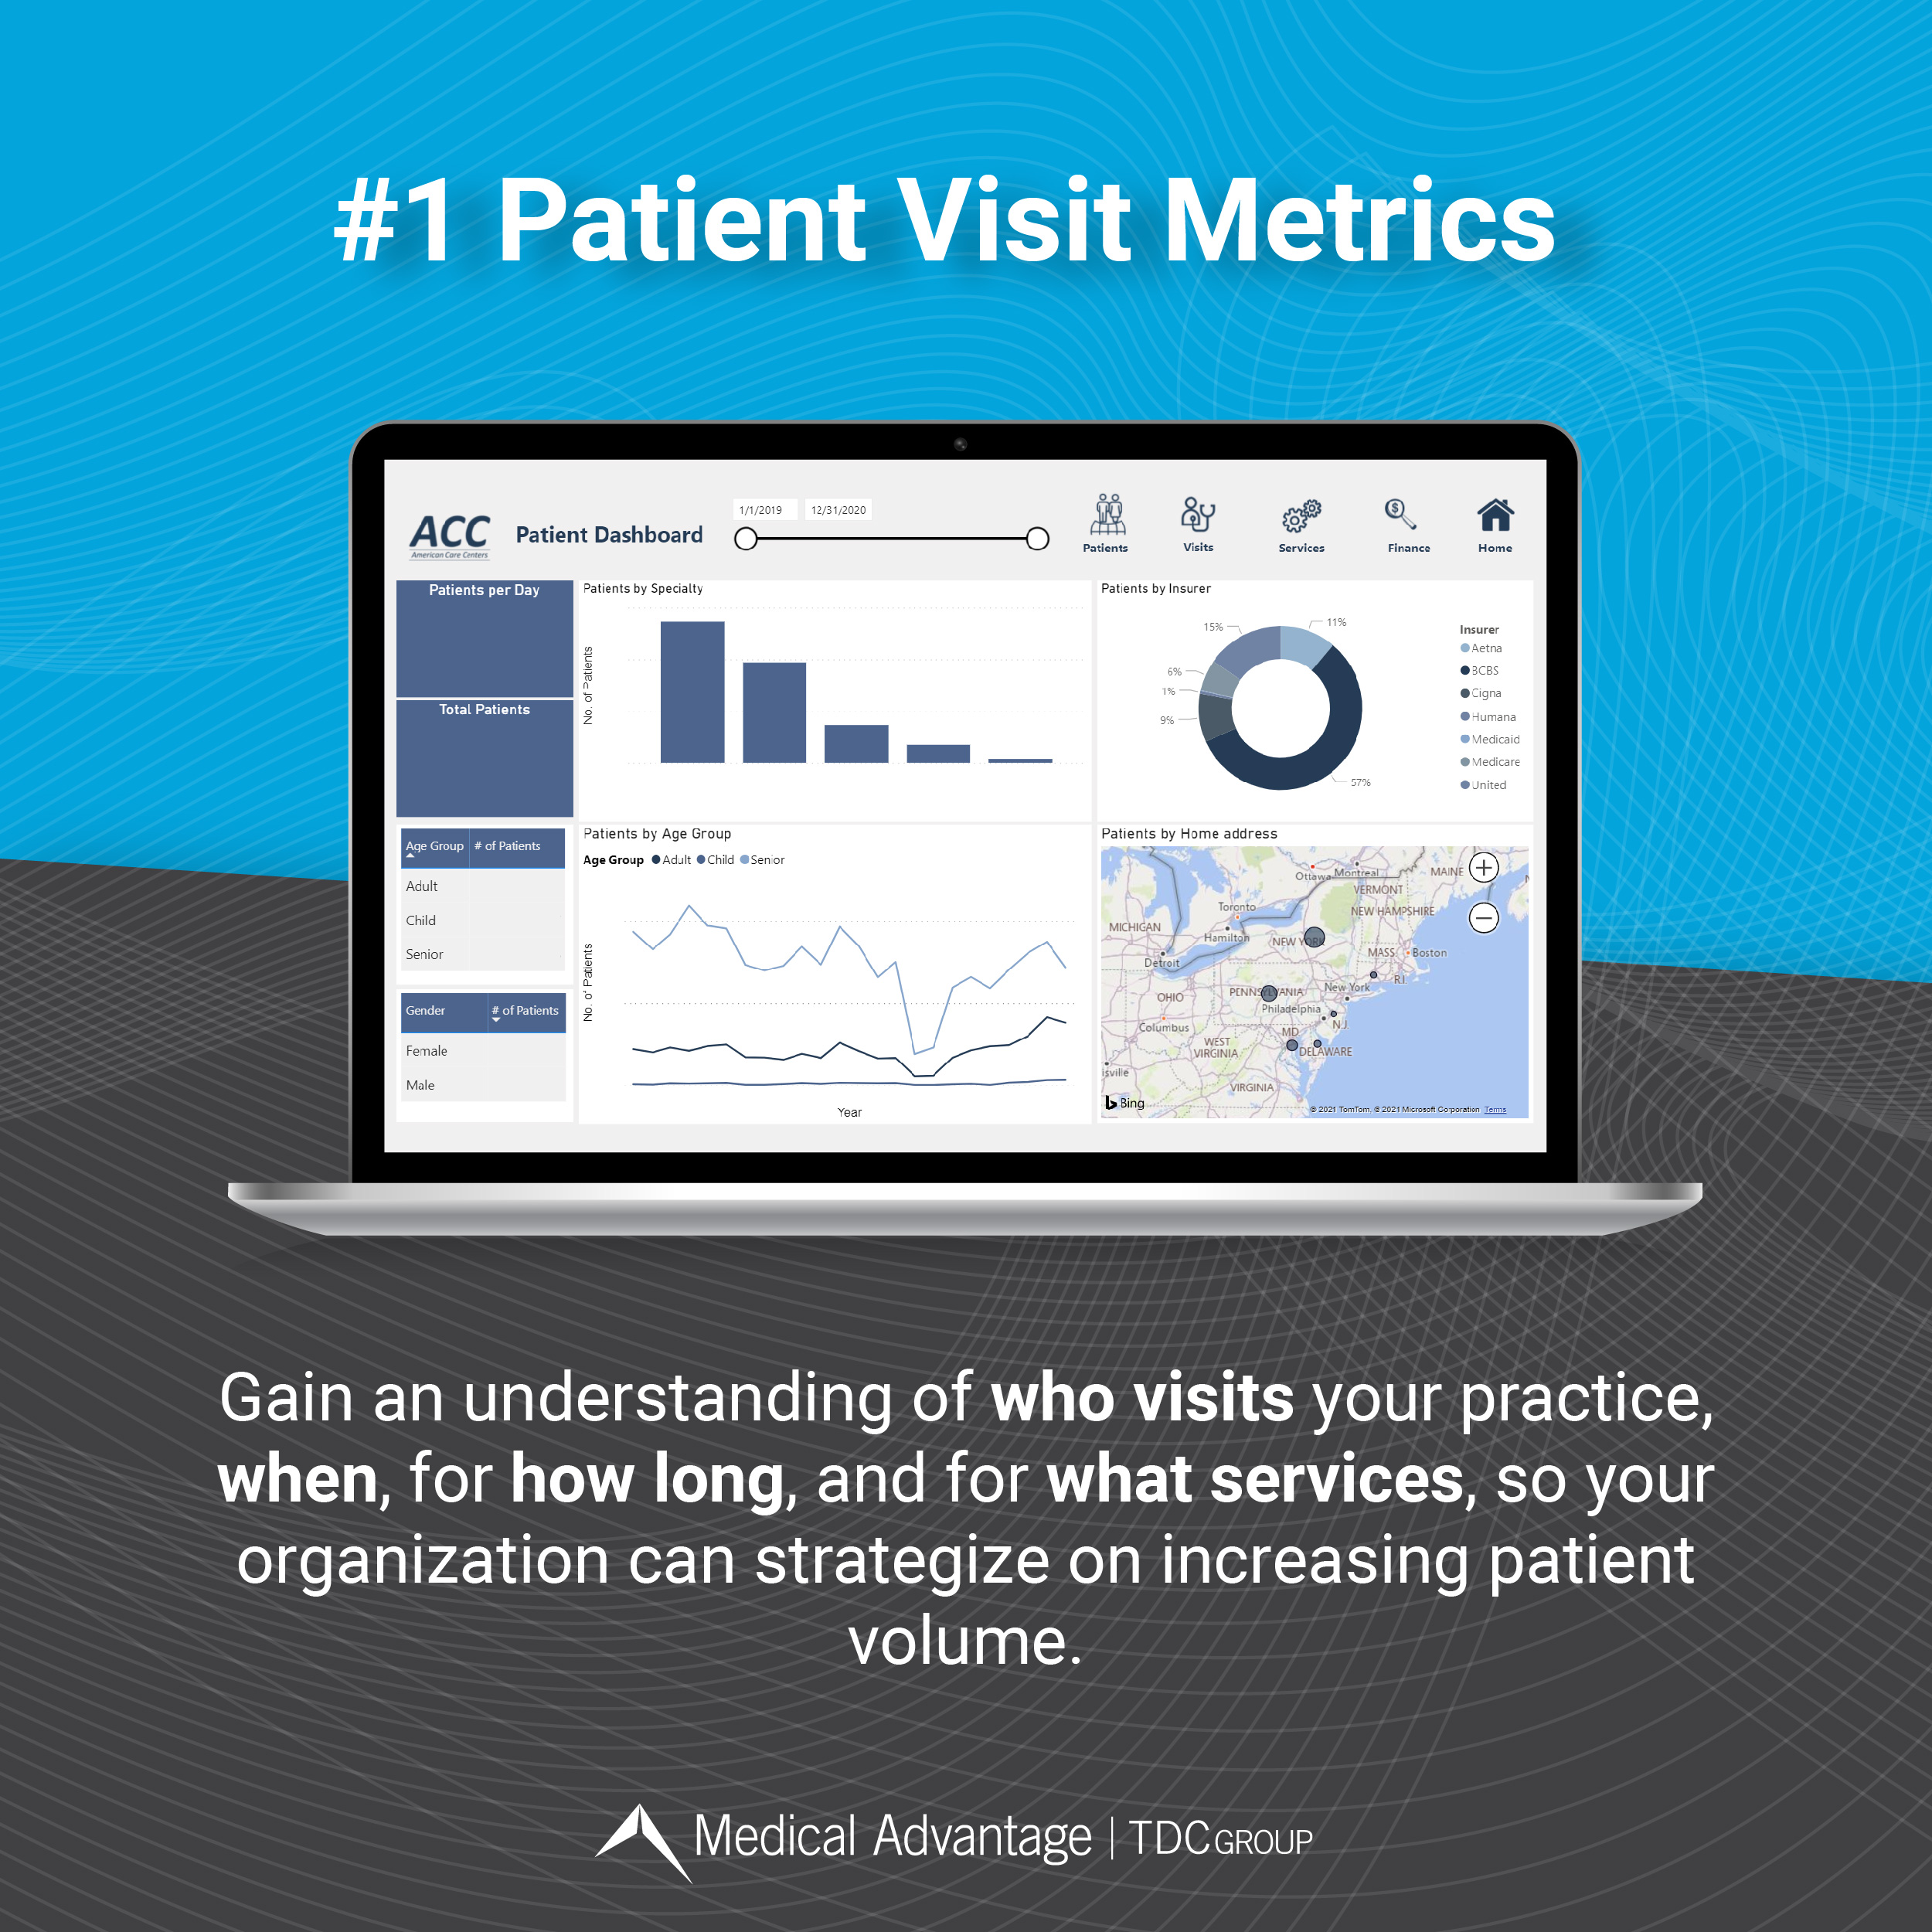
#1. Patient Visit Metrics
A reliable and growing number of patient visits to your practice forms the basis of any medical organization’s revenue stream. Accurate data about how many patients are visiting your practice, and how often patients visit your practice is crucial to maintaining and growing your medical practice cashflow.
By more effectively understanding who visits your practice, when, for how long, and for what services, your organization can effectively begin formulating a strategy to maintain and ultimately increase the number of patient visits and grow your medical practice revenue.
As part of the patient visits over time healthcare KPI, the proper healthcare dashboard solution will allow users to view metrics like visit duration, wait time, average visits by practitioner, average visits by day and month, and more.
Especially coming out of the COVID-19 pandemic – which severely reduced both visits and revenue for most practices in the U.S. – it is crucial that medical practices rebuild patient volume – and increase it to stay viable in today’s competitive healthcare market. This makes keeping track of patient visits over time one of the most critical healthcare metrics to improve medical practice performance.
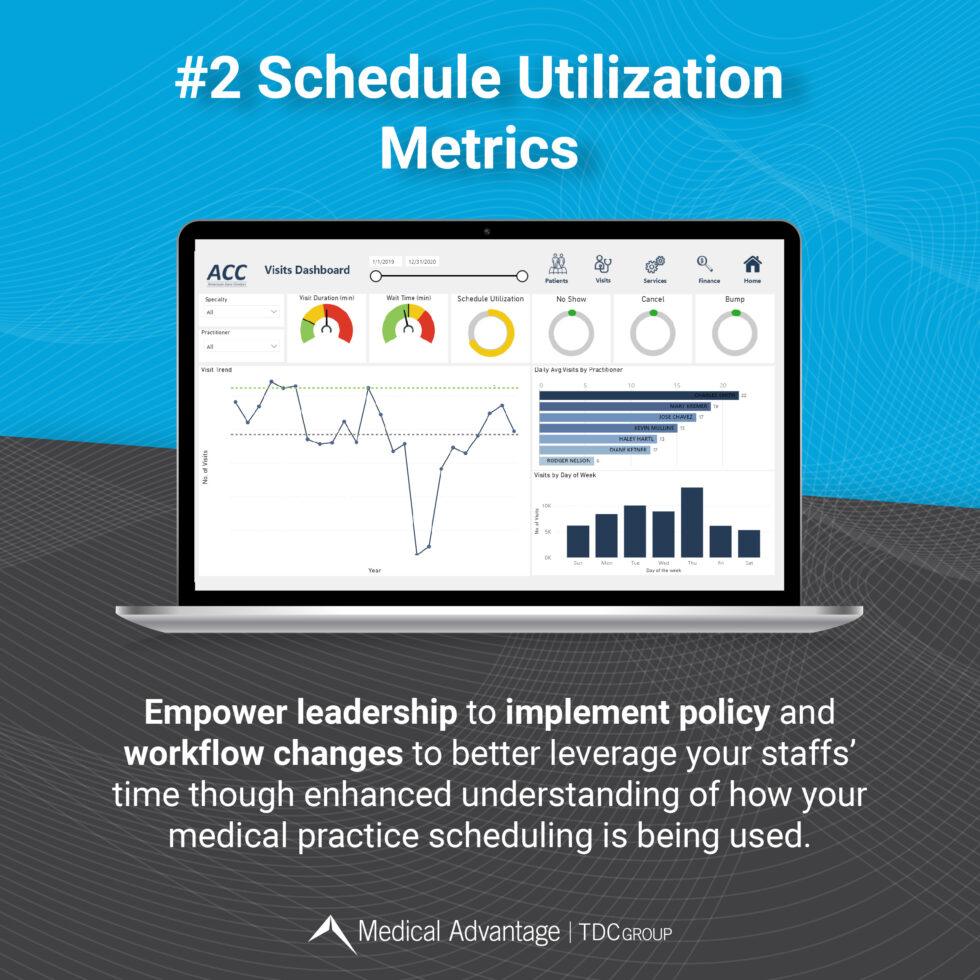
#2. Schedule Utilization Metrics
The adage “time is money” is perhaps most true for the healthcare industry, where busy practitioners and staff often have their hands full with day-to-day responsibilities like seeing patients, documenting visits, and other administrative functions. This means every hour spent is at a cost. Is your organization getting the most out of its investment?
With schedule utilization metrics, a second category of healthcare KPIs used to improve performance, practitioners and staff can view data like patient no show percentage, patient cancellation percentage, appointment bump percentage, overall schedule utilization percentage, and more. With an enhanced understanding of how their medical practice scheduling is being used, and how time could be better leveraged, practice leadership can implement policy and workflow changes to ensure staff is making the most out of their time.
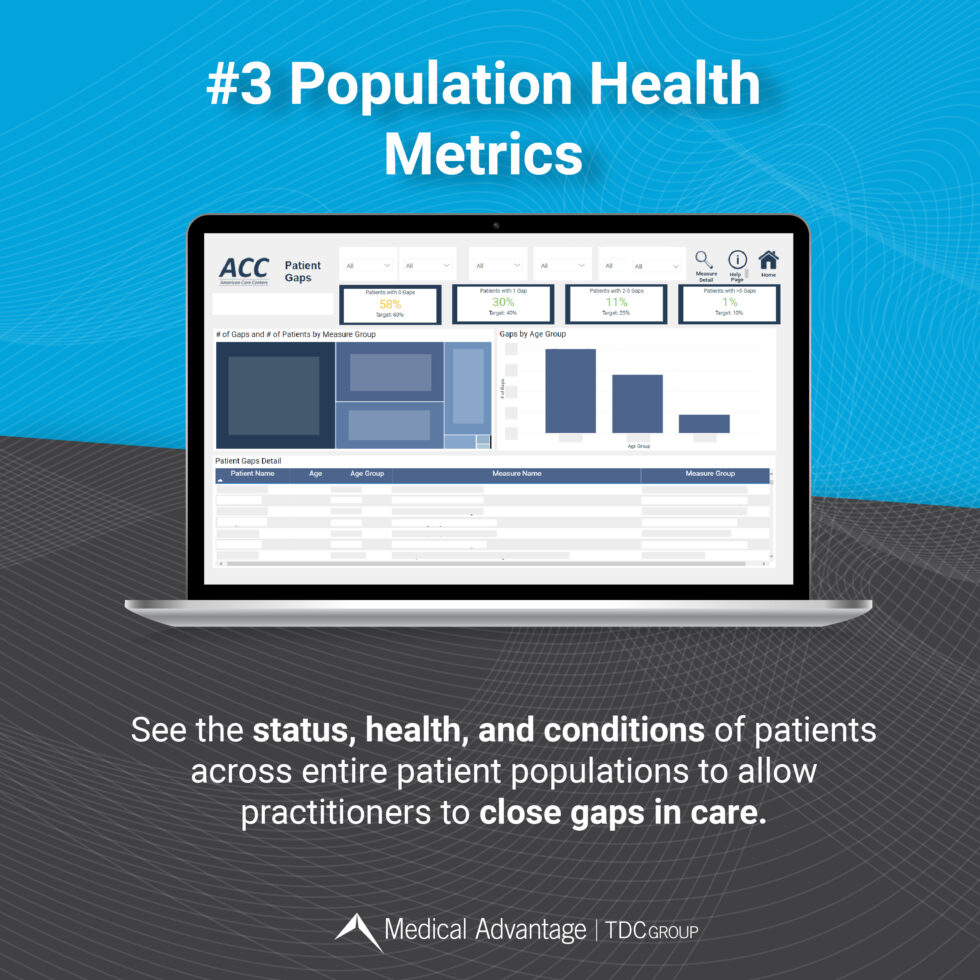
#3. Population Health Metrics
As previously touched upon, understanding when patients visit your practice is important – but so is understanding who those patients are. Many providers feel they have an idea of who their patients are on an individual, case-by-case basis – but how well do they know those same patients on a population health level?
Population health metrics allow practitioners to see the status, health, and conditions of patients across their entire patient population. The most powerful benefit of this is that it allows practitioners to close gaps in care. For example, providers can see, at-a-glance, which percentage of your patient population has been seen for their annual wellness visits, which have had certain tests or procedures performed, and those patients that are suffering from chronic conditions and if they’re conditions are being properly monitored and treated.
Not only does a population health KPI help healthcare organizations take better care of their patients, it also helps providers perform better financially. This is because many of today’s payer-contracts require certain levels of performance in some quality metrics to achieve peak reimbursement. With population health KPI metrics, providers can take strides toward improving those population-level metrics, and improving their profitability in the process – all while ensuring their patients are receiving the optimal care and treatment for their conditions.
#4. Billing and Coding Metrics
For practices, getting patients in the door is only the beginning of converting those visits into revenue. On many occasions, the real work begins once the patient has left – the work of billing, visit documentation and coding, and revenue cycle management.
For many healthcare organizations, this is easier said than done. With payers often having complex and varied fee schedules, improper coding causing denials, and inefficient processes keeping claims in accounts receivable (A/R) for unnecessarily long, getting reimbursed properly is a task in and of itself for many practices. Luckily, several healthcare performance metrics exist to diagnose and prevent the problems caused by faulty billing and coding processes.
Whether filtering by charges and payment by insurer, charges and payments over time, claim denials over time, top denial reasons, average days in A/R, average days to bill, collectability percentage, or total charges and payments – billing and coding metrics are excellent healthcare KPIs for organizations looking to ensure they are staying on top of reimbursements and ensuring a healthy practice cashflow.
Healthcare Analytics Dashboards: All Your Healthcare KPIs in One Place
Now that we have explored the importance of healthcare metrics and tracking healthcare KPIs for medical practice success– how do healthcare professionals access and view them? The answer: healthcare analytics dashboards.
Healthcare analytics dashboards are software tools which compile multiple, disparate datasets into one centralized view – and present healthcare KPIs like those mentioned above into one seamless, dynamic, and automated view – making it simple for healthcare leadership to view practice performance in sophisticated and simple dashboards.
Empowered with these performance insights, practice leadership can make data-driven decisions about business and care strategy. The result? Improved patient outcomes, increased performance in payer contracts, improvements in staff utilization rates and patient appointments, reduced physician burnout, improved staff morale, and enhanced revenue across practice operations.
Consider Medical Advantage’s Customizable, Affordable Healthcare Dashboard Solutions
With customizable healthcare analytics dashboards providing a “window” into practice performance and benchmarking against KPIs, medical professionals can view a host of healthcare performance metrics and ascertain how their organization is performing – then create or modify strategy to alter or continue those trends.
Learning more about how dashboards are utilized across healthcare is a great first step toward selecting the best program to enhance your own organization’s performance. Built for group practices, MSOs, and Private Equity firms, our healthcare dashboards consolidate practice data into easy-to-use reports which offer readouts on healthcare performance metrics – without the burden of manual report assembly.
To learn more about the range of customizable dashboard solutions offered, contact one of our consultants today.


